Master's Thesis Research v1.0 Specification Active Development

CorpusAI CO2 Emissions Model

A high-speed, mathematically grounded 3B parameter language model for interpreting Nordic Non-ETS greenhouse gas emissions data. Built through Knowledge Distillation from a 32B teacher model, anchored to verified government statistics to guarantee factual accuracy.

Programme M.Sc. Innovation & Technology Management
Specialisation Systems Engineering
Model Parameters 3B (distilled from 32B)
Inference Target AMD EPYC CPU (Ollama)
SECTION 01

Executive Summary

The CorpusAI CO2 Emissions Model is an applied research project exploring the intersection of large language model distillation, domain-specific grounding, and edge deployment for environmental data analysis. The project addresses a critical gap in the Nordic climate reporting ecosystem: the need for fast, accurate, and interpretable AI systems capable of processing Non-ETS (non-Emissions Trading System) data from national statistical bureaus.

The core innovation is a three-stage methodology:

Stage 1 Knowledge Distillation
Stage 2 Anchor Grounding
Stage 3 Edge Deployment

Knowledge Distillation (32B → 3B) compresses the reasoning capabilities of a large teacher model into a compact student model optimised for CPU inference. Anchor Data from verified government sources (SSB, Miljødirektoratet, Naturvårdsverket) is injected during training to eliminate hallucinations and ensure every output is traceable to "Ground Truth" statistics. The resulting model runs on commodity AMD EPYC hardware via Ollama, achieving sub-second response times without GPU requirements.

This specification documents the complete systems engineering lifecycle: from data preparation and model training through evaluation gates and production deployment. It serves as the technical foundation for the thesis component addressing the research question: "How can knowledge distillation and data anchoring techniques enable accurate, hallucination-free LLM inference for environmental reporting on resource-constrained hardware?"

SECTION 02

Architecture Overview

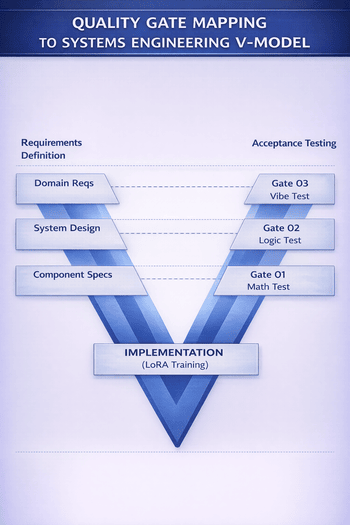
The system architecture follows a staged distillation pipeline pattern, where each component is decoupled and independently verifiable — a key systems engineering principle enabling incremental validation. The architecture comprises four primary subsystems:

CorpusAI system architecture diagram
T
The Teacher
Qwen 2.5-Coder-32B

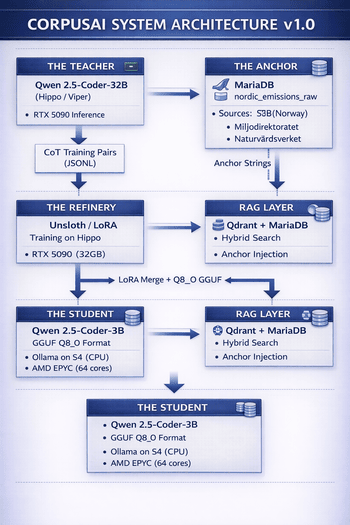
The 32-billion parameter teacher model runs on the Hippo/Viper GPU cluster (RTX 5090). It processes Anchor Data and generates Chain-of-Thought (CoT) reasoning pairs that form the training corpus for the student model. The teacher's role is to demonstrate how to think about emissions data — not just what the answer is.

S
The Student
Qwen 2.5-Coder-3B-Instruct

The 3-billion parameter student model is the deployment target. Trained via LoRA fine-tuning on the teacher's distilled outputs and anchored to verified statistics, it achieves near-teacher-level accuracy at 10× the inference speed. Quantised to Q8_0 GGUF for CPU-only deployment on the S4 server (AMD EPYC).

A
The Anchor
MariaDB · nordic_emissions_raw

The anchor layer is the system's "Ground Truth" guarantee. Raw emissions data from SSB (Statistisk sentralbyrå), Miljødirektoratet, and Naturvårdsverket is stored in a normalised MariaDB table and transformed into Natural Language Fact Sheets during training. This ensures zero hallucination on factual queries.

R
RAG Layer
Qdrant + MariaDB Hybrid Search

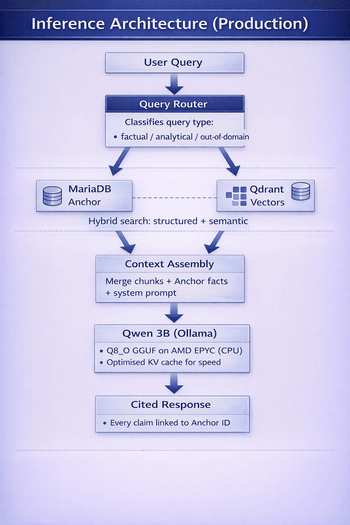
At inference time, a Retrieval-Augmented Generation (RAG) layer performs hybrid search across Qdrant vector embeddings and MariaDB structured data. Retrieved chunks and Anchor Data facts are injected into the prompt context, enabling the 3B student to provide cited, verifiable responses.

SECTION 03

Data Preparation & Synthesis

Phase 1 of the pipeline focuses on converting structured emissions data into training-ready formats. This is a two-step process: Anchor Data Extraction and Teacher Reasoning Generation.

A
3A. Anchor Data Extraction
Structured → Natural Language Fact Sheets

Raw rows from the nordic_emissions_raw table are extracted and transformed into human-readable Anchor Strings. This transformation is deterministic — every fact sheet maps 1:1 to a database row, ensuring full traceability.

Source Format (MariaDB row):

-- Example row from nordic_emissions_raw id: 501, country: 'NO', category: 'Transport', year: 2024, co2_tonnes: 1200000, location: 'Oslo'

Anchor String (output):

"In 2024, the road transport sector in Oslo, Norway, emitted 1.2 million tonnes of CO2-equivalent greenhouse gases." // Anchor ID: 501 | Source: SSB Table 08940 // Confidence: VERIFIED | Last Updated: 2025-03-01

Each Anchor String carries metadata linking back to the source row ID and the originating statistical table. This enables post-hoc auditing: any model output can be traced back through the Anchor String to the exact database row and government publication it derives from.

B
3B. Teacher Reasoning (Distillation Feed)
32B generates Chain-of-Thought training pairs

The 32B Teacher model processes each Anchor String and generates structured Chain-of-Thought (CoT) training pairs. These pairs teach the student model how to reason about emissions data — not just memorise facts.

Input Prompt to Teacher:

"Using the provided anchor data, explain the implications of these emissions relative to Norway's 2030 climate goals." // Anchor Context: [Anchor String for row 501]

Output (JSONL training pair):

{ "instruction": "Explain Oslo's 2024 transport emissions relative to Norway's 2030 Klimamålet targets.", "response": "<think> Oslo's road transport emitted 1.2M tonnes CO2-eq in 2024. Norway's Klimamålet target: 55% reduction from 1990 levels by 2030. 1990 baseline for transport: ~16M tonnes nationally. 55% reduction target: ~7.2M tonnes by 2030. Oslo represents ~7.5% of national transport emissions. Current trajectory suggests Oslo needs a 38% reduction in the remaining 6 years to meet its proportional share. </think> Oslo's road transport sector emitted 1.2 million tonnes of CO2-equivalent in 2024. Under Norway's Klimamålet framework (55% reduction from 1990 levels by 2030), this represents...", "anchor_id": 501, "pair_type": "reasoning" }

The <think> block is critical: it exposes the teacher's mathematical reasoning (percentage calculations, baseline comparisons, regulatory framework references) so the student model learns to replicate this analytical process, not just the final text.

SECTION 04

Training Configuration

The training phase (the "Refinery Pass") uses Unsloth on the Hippo GPU server to maximise throughput on the RTX 5090. The dataset is carefully balanced to produce a model that is both accurate and robust.

4A
Dataset Composition
Balanced JSONL training corpus

The training dataset is structured as a balanced JSONL corpus with three distinct pair types, each serving a specific pedagogical function:

Anchor Direct Pairs 30%
Reasoning Pairs (CoT) 50%
Robustness / Negative Pairs 20%
Pair Type Share Example Q → A Purpose
Anchor Direct 30% "What were Oslo's 2024 transport emissions?" → "1.2M tonnes" Exact factual recall from Ground Truth data
Reasoning (CoT) 50% "Compare Oslo and Stockholm waste emissions" → <think> block + result Multi-step mathematical and analytical reasoning
Negative / Robustness 20% "What are the emissions for Mars?" → "The dataset does not contain planetary data outside the Nordics" Boundary enforcement; teaches model to refuse out-of-domain queries
4B
Hyperparameters (Hippo / Unsloth)
LoRA configuration for RTX 5090

Using Unsloth on the Hippo server to maximise training throughput on the RTX 5090 (32GB VRAM). The LoRA configuration prioritises high-density adapter weights to preserve mathematical reasoning fidelity during distillation.

ParameterValueRationale
LoRA Rank (r) 64 High density required for mathematical logic preservation across distillation boundary
LoRA Alpha (α) 128 Alpha/Rank ratio of 2.0 balances adapter influence vs. base model knowledge
Target Modules q_proj, k_proj, v_proj, o_proj, gate_proj, up_proj, down_proj Full attention + MLP targeting ensures reasoning pathway modification
Learning Rate 1 × 10⁻⁴ Cosine schedule with warm-up; prevents catastrophic forgetting of base capabilities
Context Length 4,096 tokens Sufficient for CoT blocks + Anchor context; larger windows degrade training speed
Batch Size 4 (gradient accumulation: 8) Effective batch size 32; fits within 32GB VRAM budget with Unsloth optimisations
Epochs 3 Domain-specific data benefits from multiple passes; overfitting monitored via eval loss
Weight Decay 0.01 Light regularisation to prevent overfitting on small specialised datasets
Quantisation (Training) 4-bit (NF4) QLoRA approach: base model in 4-bit, adapters in float16 for precision
SECTION 05

Evaluation & Quality Gates

The model must pass three "Blue Note" quality gates before deployment. These gates are designed as sequential verification stages — inspired by systems engineering V&V (Verification and Validation) methodology — where each gate tests a progressively higher level of system capability.

Gate 01 — Verification
The Math Test
A script-based automated check of 100 queries where the model must extract the exact numerical value from the Anchor Data. No rounding, no approximation, no rephrasing — the model must reproduce the Ground Truth figure precisely.

This gate validates factual accuracy: the most fundamental requirement for an emissions reporting system. A single hallucinated number in a climate report can undermine policy decisions.
Threshold: >99% accuracy
Gate 02 — Validation
The Logic Test
Evaluates the <think> block for correct mathematical operations. When the model claims a "Total," is it actually the sum of the referenced "Sectors"? When it calculates a percentage change, is the arithmetic correct?

This gate validates reasoning integrity: ensuring the distilled model hasn't learned to produce plausible-sounding but mathematically incorrect Chain-of-Thought sequences.
Threshold: >95% logical consistency
Gate 03 — Acceptance
The "Vibe" Test
A human evaluation ensuring the model uses professional Norwegian/English terminology appropriate for government and academic audiences. No "AI-babble," no sycophantic preambles ("Great question!"), no hedging beyond what's scientifically warranted.

This gate validates domain appropriateness: the model must read like a report from a climate analyst, not a chatbot. Terminology must align with SSB and Miljødirektoratet standards.
Threshold: Expert panel approval

QUALITY GATE MAPPING TO SYSTEMS ENGINEERING V-MODEL

CorpusAI V-Model verification and validation diagram
SECTION 06

Deployment Pipeline

Phase 4 transforms the trained LoRA adapters into a production-ready inference system. The pipeline is designed for deterministic reproducibility: every step is scripted, version-controlled, and produces bit-identical outputs from identical inputs.

Step 1 LoRA Merge
Step 2 GGUF Convert
Step 3 Q8_0 Quantise
Step 4 Ollama Deploy
Merge & Quantise

LoRA adapters are merged into the base Qwen 2.5-Coder-3B model using Unsloth's merge utilities. The merged model is then converted to GGUF format and quantised to Q8_0 (8-bit quantisation). Q8_0 is selected over Q4_K_M for this use case because mathematical precision is paramount — the marginal speed improvement of 4-bit quantisation does not justify the risk of numerical rounding artifacts in emissions calculations.

RAG-Augmented Inference

The deployed model runs via Ollama on Server 4 (AMD EPYC, 64 cores). At query time, a two-step prompt routing process ensures accuracy:

Step 1: Hybrid search retrieves relevant chunks from Qdrant (semantic similarity) and MariaDB (structured query) based on the user's question.

Step 2: The 3B model interprets the retrieved chunks alongside injected Anchor Data facts to produce a final, cited response. Every claim is traceable to a source row.

Inference Architecture (Production)
CorpusAI production inference interface architecture diagram
SECTION 07

Critical Performance Bottlenecks

Two critical bottlenecks have been identified during initial prototyping. Both require pre-deployment mitigation to ensure production reliability.

Bottleneck 1: Encoding Artifacts

Nordic characters (å, ø, æ, ä, ö) in source data may produce HTML entity artifacts (&#xE5;, &#xF8;) when scraped from web-based statistical interfaces. If these artifacts persist into the training data, the 3B model may learn to reproduce them in outputs — generating responses like "Milj&#xF8;direktoratet" instead of "Miljødirektoratet".

Mitigation: The "Hex Scrub" pre-processing script must run on all source data before the Teacher generates training pairs. This script normalises all HTML entities to their UTF-8 equivalents and validates character encoding consistency across the entire nordic_emissions_raw table.

Bottleneck 2: KV Cache Bloat (CPU Inference)

On the S4 server (AMD EPYC, CPU-only inference), the Key-Value cache grows linearly with context length. At the full 4,096 token training context, inference latency degrades significantly as the KV cache consumes available RAM bandwidth. The EPYC's memory subsystem, while ample in capacity, cannot match GPU HBM bandwidth for random access patterns typical of transformer attention.

Mitigation: Production inference context is capped at 2,000 tokens. The RAG layer pre-filters retrieved chunks to stay within this budget. This constraint is acceptable because the 3B model's primary function is interpretation of pre-retrieved data, not open-ended generation. The 2K context window comfortably fits: system prompt (~200 tokens) + retrieved chunks (~800 tokens) + Anchor facts (~400 tokens) + generation headroom (~600 tokens).

SECTION 08

Systems Engineering Context

This project is developed within the framework of a Master of Science in Innovation and Technology Management with a specialisation in Systems Engineering. The specification deliberately maps to established SE methodologies:

Requirements Engineering

The three Quality Gates (Section 5) directly implement INCOSE SE Handbook requirements verification categories: Inspection (Math Test — automated numerical verification), Analysis (Logic Test — mathematical consistency checking), and Demonstration (Vibe Test — expert panel evaluation). Each gate has explicit pass/fail criteria, ensuring requirements traceability from stakeholder needs to test results.

V-Model Integration

The project lifecycle follows the V-Model pattern: left side (decomposition) maps Domain Requirements → System Design → Component Specifications, while the right side (integration) maps unit-level verification (Gate 01) through system-level validation (Gate 02) to acceptance testing (Gate 03). This structure is documented in Section 5's V-Model diagram.

Interface Management

The architecture's four subsystems (Teacher, Anchor, Refinery, RAG) communicate through well-defined interfaces: JSONL for training data exchange, SQL for anchor queries, GGUF for model serialisation, and REST APIs for inference. Each interface has a defined data contract, enabling independent development and testing of subsystems.

Innovation Management Lens

From an innovation perspective, CorpusAI represents a process innovation in environmental reporting: applying knowledge distillation to create domain-expert AI systems that can operate on commodity hardware. The commercial viability thesis is that organisations (municipalities, environmental agencies) can deploy specialised AI models without cloud dependency or GPU infrastructure costs — a significant barrier reduction for Nordic public sector adoption.

Research Methodology Alignment
SE ConceptCorpusAI ImplementationThesis Section
Stakeholder Analysis Nordic climate agencies (SSB, Miljødirektoratet), municipal planners, policy researchers Chapter 2
Requirements Decomposition Accuracy (>99%), speed (<1s), domain-bounded, CPU-deployable, hallucination-free Chapter 3
Architecture Design Teacher-Student-Anchor-RAG four-subsystem decomposition (Section 2 of this spec) Chapter 4
Verification & Validation Three-gate quality framework: Math, Logic, Vibe (Section 5 of this spec) Chapter 5
Configuration Management Git-controlled training configs, versioned GGUF artifacts, reproducible pipeline scripts Chapter 6
Risk Management Encoding artifacts, KV cache bloat, domain boundary leakage (Section 7 of this spec) Chapter 7
SECTION 09

Next Steps

1
Run the Scraper
Data Collection

Ensure the nordic_emissions_raw table has at least 5,000 fresh rows from SSB, Miljødirektoratet, and Naturvårdsverket. Run the Hex Scrub encoding normalisation on all ingested data.

2
Generate the Feed
Training Data Synthesis

Use the 32B Coder on Viper to build the first 2,000 Q&A pairs following the 30/50/20 dataset composition. Validate JSONL format and anchor ID integrity before training.

3
Train & Evaluate
Refinery Pass

Execute LoRA training on Hippo via Unsloth. Run all three Blue Note quality gates. Iterate on dataset composition if Gate 01 or 02 fail.

4
Deploy to S4
Production Release

Merge adapters, quantise to Q8_0 GGUF, deploy via Ollama on S4. Configure RAG layer with Qdrant + MariaDB hybrid search. Production context cap: 2,000 tokens.

CorpusAI CO2 Emissions Model v1.0

A GilliganTech Research Project — Blue Note Logic Inc. × Gilligan Tech ENK

Master of Science · Innovation & Technology Management · Systems Engineering

👤 Dave Gilligan Creator & Architect
🎵 Blue Note Logic Inc. Infrastructure & Tech
🇳🇴 Gilligan Tech ENK Local Operations, Norway